The modified Mediterranean ketogenic diet significantly altered the plasma lipidome at a class level
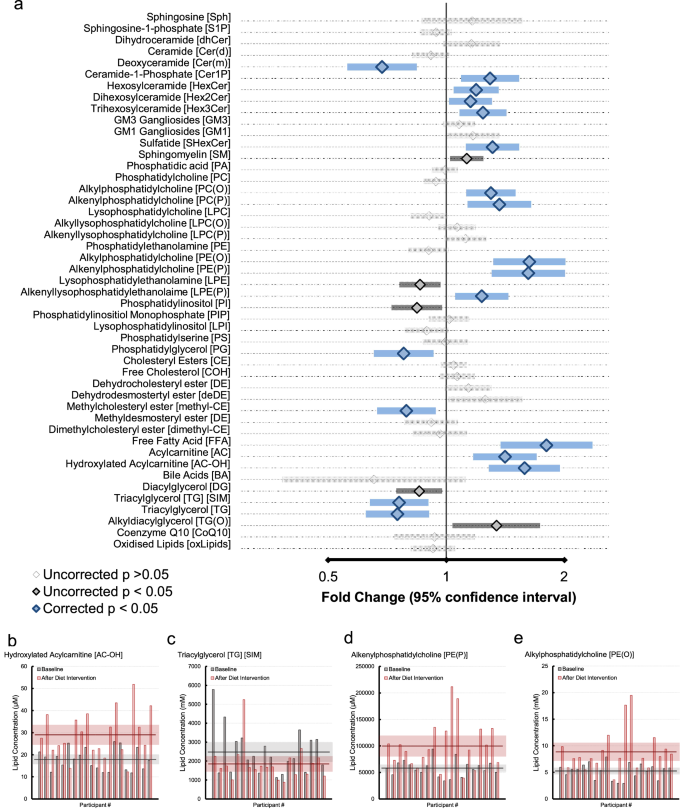
Lipidomic measures were taken on all plasma samples collected in the study. We examined the impact of the MMKD and American Heart Association Diet (AHAD) on the plasma lipidome using linear mixed models after each dietary intervention. Significant impacts on the plasma lipidome were observed in the MMKD (Fig. 1a) with 18 of the 47 categorized lipid classes presenting an association with a false discovery rate (FDR) corrected p value < 0.05. In contrast, the AHAD had no associations after FDR correction, but 12 lipid classes presented with nominal associations with uncorrected p < 0.05 (Supplementary Data 1). There were minimal impacts to the lipidome after washout periods relative to pre-study baseline (Supplementary Fig. 1).
a Forest plot highlighting significant lipid classes associated with the 6-week MMKD (n = 20) from a linear mixed model. Units are in fold change of lipid concentration from baseline with 95% confidence intervals. Light grey, uncorrected p value > 0.05, dark grey, uncorrected p value < 0.05, blue, Benjamini-Hochberg corrected p value < 0.05. b–e Relative concentration of each lipid class for each participant at baseline (grey) and follow-up (red). Horizontal bars represent mean concentration for baseline and follow up with 95% confidence intervals. Exact p-values and coefficients are in Supplementary Data 1.
Fatty acid oxidation
Many of the changes associated with the plasma lipidome were expected with ketosis. The ketogenic diet would typically induce lipolysis, and ultimately shift towards fatty acid oxidation as an energy source rather than glucose54,55. We observed significant increases to the lipid classes acylcarnitines (AC, 1.41-fold increase, 1.20−1.67 95% CI, corrected p value = 4.83 × 10⁻³), hydroxylated acylcarnitines (AC-OH, 1.58-fold increase, 1.31−1.91 95% CI, corrected p value = 2.15 × 10⁻³) and free fatty acids (FFA, 1.80-fold increase, 1.40−2.31 95% CI, corrected p-value = 2.20 × 10⁻³) all indicative of increased lipid lipolysis and increased carnitine shuttling for fatty acid oxidation55. These changes corresponded to declines in the triglyceride class (TG [NL], 0.75-fold change, 0.64−0.89 95% CI, corrected p-value = 1.20 × 10⁻²), thus together indicating conversion of more complex triglycerides into their free fatty acids and shuttling into mitochondria within cells and tissues for fatty acid oxidation56,57. Inspection of changes to lipid concentration at an individual level highlighted variable responses to MMKD for classes that increased (AC-OH, Fig. 1b) and decreased (TG, Fig. 1c). The changes to these lipids were strongly correlated with clinical ketone body measurements (Supplementary Fig. 2).
Ether lipid metabolism
Unexpectedly, we observed a strong shift of ether glycerophospholipid concentrations within the peripheral lipidome after MMKD intervention. Ether lipids are a subgroup of lipids all sharing either the ether or vinyl-ether linkage in the sn1 position on the glycerol backbone58,59,60. The strongest and most notable associations were observed with the two ethanolamine ether lipid classes, both in similar magnitudes, alkylphosphatidylethanolamine [PE(O)] concentration (1.63-fold change, 1.35−1.97 95% CI, FDR corrected p value = 2.15 × 10⁻³) and the plasmalogen alkenylphosphatidylethanolamine [PE(P)] concentration (1.62-fold change, 1.33−1.97 95% CI, FDR corrected p value = 2.15 × 10⁻³). In contrast, the non-ether glycerophospholipid, phosphatidylethanolamine (PE), was not associated with MMKD intervention (0.90-fold change, 0.80−1.01 95% CI, corrected p value = 1.54 × 10⁻¹) despite sharing many of the other structural characteristics to PE(O) and PE(P). Direct comparison of absolute lipid concentrations within individuals in response to the MMKD diet highlights differential responses (Fig. 1d,e) with some individuals showing a 6-fold increase in PE(P) levels.
Similarly, the corresponding choline glycerophospholipid classes, alkylphosphatidylcholine, PC(O) and the plasmalogen alkenylphosphatidylcholine, PC(P), shared significant increases albeit with smaller effect sizes (PC(O) concentration, 1.30-fold increase, 1.15−1.47 95% CI, corrected p value = 4.83 × 10⁻³ and PC(P) concentration, 1.37-fold increase, 1.16−1.61 95% CI, corrected p-value = 8.49 × 10⁻³, Fig. 1a). These changes mirror the ethanolamine class with no associations observed in the more abundant phosphatidylcholine class (PC, 0.94-fold change, 0.87−1.01 95% CI, corrected p value = 1.62 × 10⁻¹).
Interestingly, the atypical ether lipid, alkyldiacylglycerol [TG(O)] had nominally significant increases (1.34-fold increase, 1.04 − 1.73 95% CI, corrected p value = 7.62 × 10⁻², uncorrected p-value 3.73 × 10⁻², Fig. 1a) in stark contrast to the large reductions in circulating triglyceride content (Fig. 1a). Despite sharing similar characteristics (3 long fatty chains on a glycerol backbone) these two lipid classes differ by the ether linkage on the sn1 position of the glycerol unique to ether lipids. Together, these appear to indicate shifts to ether lipid content in all pools with MMKD independent of bulk changes to glycerophospholipids. Similarly, the changes to these lipids were strongly correlated with clinical ketone body measurements (Supplementary Fig. 2).
Reductions in pathological sphingolipids
The accumulation of the unusual sphingolipid deoxyceramide (Cer(m)) has been associated with multiple metabolic disorders, more so than the well-reported ceramide class61,62. Deoxyceramides are synthesized via the promiscuous utilization of alanine or glycine instead of serine when synthesizing the sphingolipid backbone63. We observed significant reductions in circulating deoxyceramides (0.69-fold change, 0.57–0.82 95% CI, corrected p value = 4.83 × 10⁻³) in response to MMKD.
In general, many of the complex sphingolipid classes were increased significantly. As our lipidomic platform does not have the necessary isomeric separation to separate the structural isomers of the hexose group, more complex sphingolipids are annotated with the number of hexose groups rather than their explicit structure. All hexosylceramides were increased (hexosylceramide (HexCer), 1.19-fold change, 1.07−1.33 95% CI, corrected p value = 2.00 × 10⁻²; dihexosylceramide (Hex2Cer), 1.15-fold change, 1.04−1.28 95% CI, corrected p value = 3.13 × 10⁻²; and trihexosylceramide (Hex3Cer), 1.24-fold change, 1.10 − 1.40 95% CI, corrected value = 8.75 × 10⁻³). In human plasma, HexCer is predominately the glucosylceramide isoform (the other being the galactosylceramide), where Hex2Cer is the sphinglolipid with a lactose headgroup (lactosylceramide).
Lipid species-specific responses to the modified Mediterranean ketogenic diet
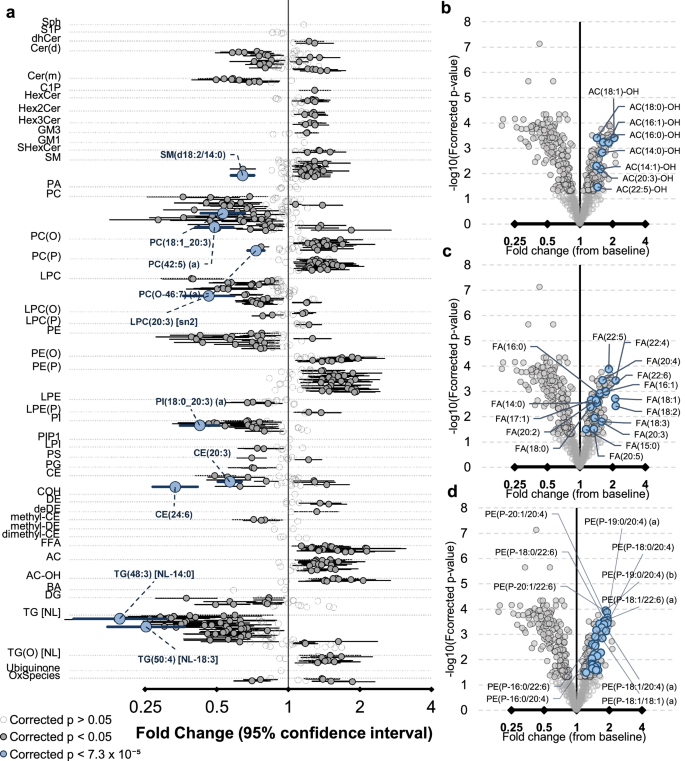
While classes prove an overview of the changes at a higher level with dietary intervention, we observed intricate associations driven by specific species not seen at the class level. After FDR correction, we observed 393 lipid species (out of 784, Fig. 2a) associated with MMKD intervention with 16 lipid species associated with the AHAD intervention (Supplementary Data 2).
a Associations of lipid species with 6-week MMKD (n = 20) obtained from a linear mixed model. Units are in fold change of lipid concentration from baseline with 95% confidence intervals. Light grey, corrected p value > 0.05, dark grey, Benjamini-Hochberg corrected p value < 0.05, blue, top 10 species ranked by p-value. b–d Volcano plot highlighting specific lipid classes associated with MMKD intervention, light grey circles, Benjamini-Hochberg corrected p value > 0.05, bolded grey circles, Benjamini-Hochberg corrected p value < 0.05, blue highlighted circles, class specific species that are Benjamini-Hochberg corrected p value < 0.05. FA: Fatty Acid, NL: Neutral Loss, Ox: Oxidized. For the spelling of lipid species abbreviations, see Fig. 1. Exact p values and coefficients are in Supplementary Data 2.
Fatty acid oxidation
Within the acylcarnitine and hydroxylated acylcarnitine classes, the associations with the largest effect size with MMKD intervention were the hydroxylated species with a 16:0, 16:1 and 18:1 fatty acid (AC(16:0)-OH, 1.63-fold change, 1.35−1.97 95% CI, corrected p value = 5.84 × 10⁻⁴; AC(16:1)-OH, 1.84-fold change, 1.45−2.33 95% CI, corrected p value = 6.06 × 10⁻⁴; AC(18:1)-OH, 2.07-fold change, 1.58−2.70 95% CI, corrected p-value = 3.93 × 10⁻⁴) (Fig. 2b, Supplementary Data 2). Similar but smaller associations were seen in the non-hydroxylated species. All free fatty acid species were significantly increased with MMKD intervention, but the strongest associations were driven by several polyunsaturated fatty acids (PUFAs) (FA(22:5), 1.84-fold change, 1.47−2.31 95% CI, corrected p value = 1.33 × 10⁻⁴; FA(20:4), 1.61-fold increase, 1.36−1.92 95% CI, corrected p-value = 3.68 × 10⁻⁴; FA(22:4), 2.14-fold increase, 1.62−2.81 95% CI, corrected p value = 3.73 × 10⁻⁴; and FA(22:6), 1.74-fold increase, 1.38−2.19 95% CI, corrected p value = 1.00 × 10⁻³) (Fig. 2c, Supplementary Data 2). Declines to the triglyceride species were heavily skewed towards species with saturated or monounsaturated fatty acids, most notably species from 14:0, 16:0 and 16:1 classes (Supplementary Data 2), while species likely common in the diet (Monounsaturated species including 18:1, and PUFA species including 20:5) had minimal declines. Interestingly, several species with docosahexanoic acid (DHA, 22:6) had nominally significant increases with intervention in contrast to the class level changes, with a single species associated after FDR correction (TG(54:6) [NL-22:6], 1.63-fold increase, 1.12−2.37 95% CI, corrected p value = 4.33 × 10⁻²). Importantly, we observed a significant decrease to CE(24:6) (0.33-fold change, 0.27–0.42 95% CI, corrected p value = 2.27 × 10⁻⁶) with corresponding increases to CE(22:6) (1.45-fold change, 1.16−1.81 95% CI, corrected p value = 1.18 × 10⁻²), which highlights peroxisome-driven β-oxidation for PUFA synthesis (Supplementary Data 2).
Ether lipid metabolism
While the abundant glycerophospholipids remain largely unaltered (e.g. PC(16:0_18:1), 0.98-fold change, 0.90−1.07 95% CI, corrected p value = 7.08 × 10⁻¹), significant species-level differences were seen, largely with PUFA fatty acids, such as DHA increased (PC(16:0_22:6), 1.39-fold increase, 1.14−1.69 95% CI, corrected p value = 1.16 × 10⁻²; PC(44:12), 1.84-fold increase, 1.25 − 2.71 95% CI, corrected p-value = 1.70 × 10⁻²). This is also reflected in the ethanolamine glycerophospholipids (Fig. 2a, Supplementary Data 2).
We observed stronger changes with the MMKD in ethanolamine ether lipids that were esterified to PUFA species. These included species with a 20:4 (e.g. PE(P-18:0/20:4) concentration, 1.92-fold change, 1.52−2.42 95% CI, corrected p value = 3.57 × 10⁻⁴) and 22:6 (e.g. PE(P-18:0/22:6) concentration, 1.83-fold change, 1.48−2.25 95% CI, corrected p value = 2.98 × 10⁻⁴) (Fig. 2d, Supplementary Data 2). The length of the sn1 position (alkyl/alkenyl) linkages did not appear to contribute differently to the association. Despite stronger changes with PUFAs in the sn2 position still strongly associated with the intervention (PE(P-18:0/18:1), 1.48-fold change, 1.25–1.76 95% CI, corrected value = 1.24 × 10⁻³) indicating an association driven by the ether lipids, not just increases to PUFAs. These effects are also reflected in the equivalent choline classes, PC(O) and PC(P).
The impact of the MMKD intervention to the plasma lipidome was stronger in specific subgroups
Cognitive group interaction
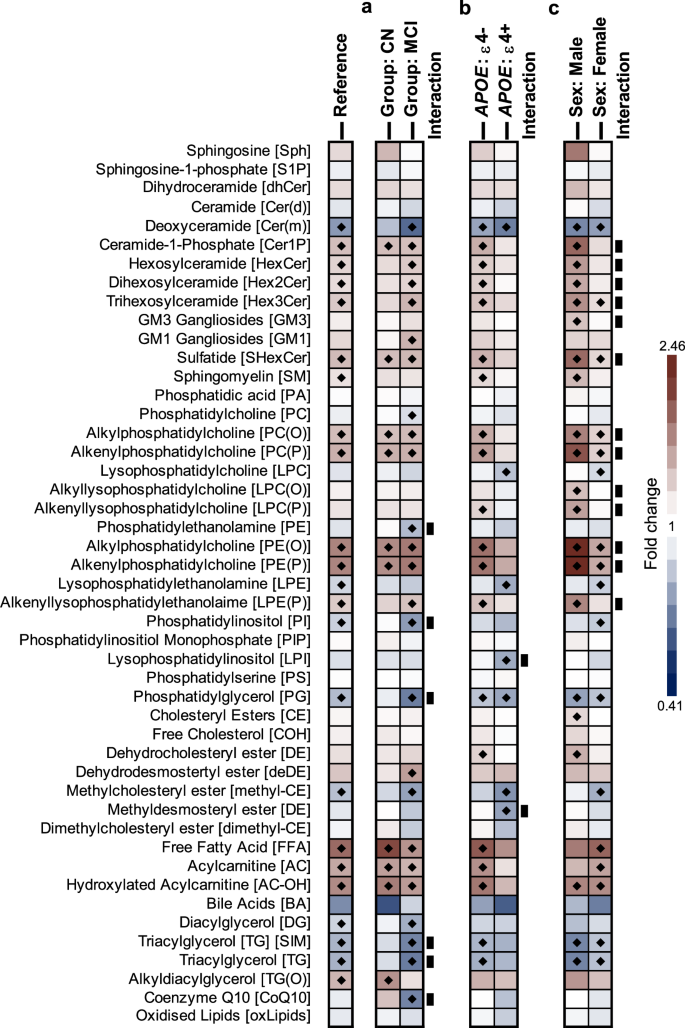
Nine individuals were classified as MCI out of the 20 included as part of the trial. Interactions were weak, with 5 lipid classes presenting with a nominally significant (nominal p value < 0.05) interaction. These classes are: phosphatidylethanolamine (PE), phosphatidylinositol (PI), phosphatidylglycerol (PG), ubiquinone (CoQ10) and triglycerides (Fig. 3, Supplementary Data 3) in which the negative associations were stronger with the MCI group, notably the phosphatidylethanolamine (PE, 0.78-fold change, 0.67−0.91 95% CI, corrected p value = 2.34 × 10⁻²) and triglyceride (TG, 0.62-fold change, 0.49−0.77 95% CI, corrected p value = 6.61 × 10⁻³) (Fig. 3, Supplementary Data 3) classes. Examination of the baseline concentration differences in these lipid classes highlighted nominally higher concentrations within the MCI group, including PE (1.50-fold difference, 1.04−2.17 95% CI, uncorrected p value = 3.15 × 10⁻²) and TG (1.65-fold change, 1.07−2.54 95% CI, uncorrected p value = 2.58 × 10⁻²) (Supplementary Data 3). Together, this indicates a small normalizing effect of the perturbed lipidome identified in the MCI group of this smaller study. This finding requires further investigation in studies designed with sufficient statistical power.
A heatmap highlighting lipid associations with MMKD intervention (n = 20) stratified using an interaction term for cognitive group (a), APOE genotype (b) and sex (c). Reference denotes the unadjusted linear mixed model on lipid associations with MMKD intervention. Black diamonds, nominal p value < 0.05, black block, nominal interaction p value < 0.05. Both nominal and corrected p-values are in Supplementary Datas 3–5. APOE: Apolipoprotein E, CN: Cognitively Normal, MCI: Mild Cognitive Impairment, MMKD: Modified Mediterranean-Ketogenic Diet.
APOE genotype interaction
Six participants had a copy of the APOE Ɛ4 allele. Overall, we observed only minor interactions between lipid concentrations after MMKD by APOE Ɛ4 status (Supplementary Data 4). However, several plasma lipid changes differed by APOE status after MMKD intervention, in which lipid associations were only significant for the non-APOE Ɛ4 individuals; for example: PE(O) (APOE Ɛ4 – PE(O), 1.37-fold change, 0.97−1.93 95% CI, corrected p value = 3.35 × 10⁻¹ and non-APOE Ɛ4 – PE(O), 1.76-fold change, 1.40−2.20 95% CI, corrected p value = 2.34 × 10⁻³), in which lipid associations were only significant for the non-APOE Ɛ4 individuals. This effect was observed for all impacted lipid classes (Supplementary Data 4). While the reduction in association can’t be completely attributed to the APOE Ɛ4 genotype in this study, it’s an interesting observation that warrants further investigation.
Sex-specific interactions
We observed differences in the strength of associations with multiple ether lipid classes when examining sex-specific interactions. Despite the difference in numbers (5 males, 15 females), the associations were stronger in males (PE(P), 2.52-fold change, 1.82−3.48 95% CI, corrected p-value = 9.37 × 10⁻⁴) compared to females (PE(P), 1.40-fold change, 1.16−1.68 95% CI, corrected p value = 2.45 × 10⁻²) with a nominally significant interaction p value (p = 6.48 × 10⁻³) (Fig. 3, Supplementary Data 5). This difference was not attributed to specific lipid class concentrations between males and females (Supplementary Data 5).
Alteration to the plasma lipidome with the Modified Mediterranean Ketogenic Diet is inversely related to the signature observed in Alzheimer’s disease
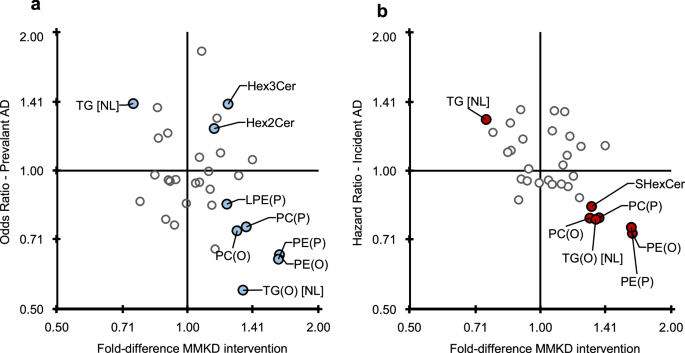
One of the striking changes associated with the MMKD was its impact on several lipid classes previously identified to associate with AD34. We correlated the lipid class associations identified with MMKD intervention to associations previously reported for prevalent and incident AD in The Australian Imaging, Biomarker & Lifestyle Flagship Study of Ageing (AIBL) and ADNI studies. A negative correlation was observed between the coefficients of the MMKD intervention changes and those with prevalent AD (−0.36 (−0.70 to −0.03), p = 4.04 × 10⁻²), and incident AD (−0.58 (−0.87 to −0.28) p = 5.6 × 10⁻⁴). The distinct AD lipidome signature is highlighted by alterations in sphingolipid: dihydroceramides (dhCer), Hex3Cer, GM3 gangliosides (GM3), GM1 gangliosides (GM1), sulfatides, and ether lipids PC(O), PC(P), PE(O), PE(P), TG(O)34. An inverse relationship was observed for most of the classes, notably for all of the ether lipid classes: PE(P), PE(O), PC(O), PC(P), and TG(O) for both prevalent and incident disease (Fig. 4a,b, Supplementary Data 6). It was noted that some of the glycosphingolipids (HexCer and Hex2Cer) were positively associated with AD risk but were increased with MMKD intervention (Fig. 4a).
A scatter plot correlating lipid class associations with MMKD intervention and Alzheimer’s disease (data previously reported Huynh et al. 2020). a Lipid classes nominally associated with both MMKD and prevalent/existing AD (highlighted in blue, class totals, meta-analysis of both AIBL and ADNI) and b Lipid classes nominally associated with both MMKD and incident/future risk of AD (highlighted in red). Exact p-values and coefficients are in Supplementary Data 6. AD: Alzheimer’s Disease, Hex2Cer: Dihexosylceramide, Hex3Cer: Trihexosylceramide, LPE: Lysophosphatidylethanolamine, MMKD: Modified Mediterranean-Ketogenic Diet, NL: Neutral Loss, PC: Phosphatidylcholine, PE: Phosphatidylethanolamine, SHexCer: Sulfatide, TG: Triglyceride.
Changes to several CSF and cognitive markers of Alzheimer’s disease correlated with the changes in the peripheral lipidome
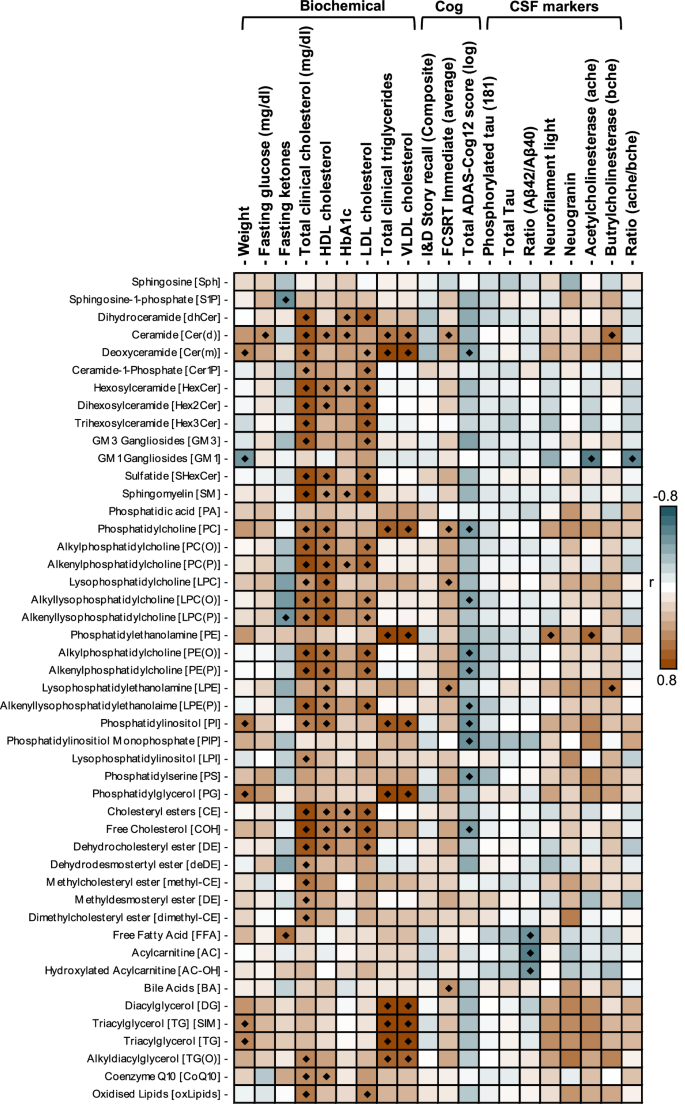
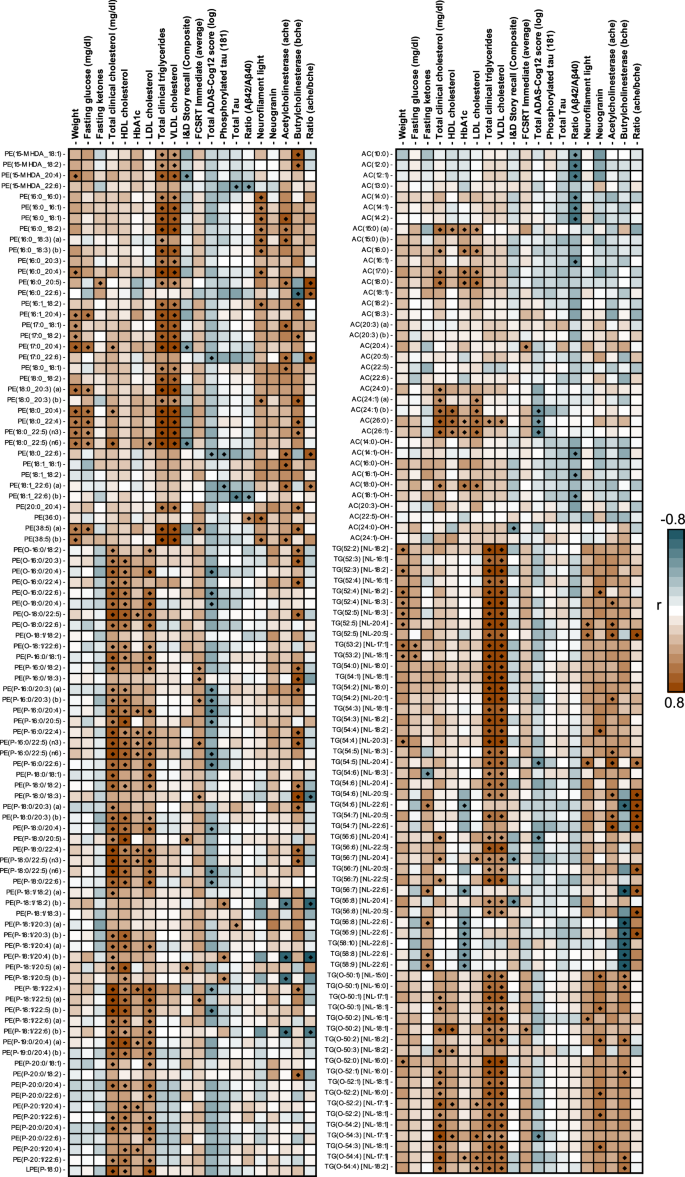
We next examined whether any of the lipid changes identified in plasma after diet intervention were associated with changes observed in various AD blood, CSF and cognition measures. Significant positive correlations in changes to both lipid classes and blood biochemical measurements were observed for all clinical measures (total cholesterol, triglycerides, high-density lipoprotein cholesterol, low-density lipoprotein cholesterol and very low-density lipoprotein cholesterol) as expected (Fig. 5). Species-dependent correlations were observed in which clinical measurement of triglycerides were not associated with species esterified with a 22:6 (DHA) fatty acid (Fig. 6). Correlations between the changes in lipid classes and fasting ketones level were predominately seen in the free fatty acid lipid class (FFA, r = 0.62) and were inversely correlated with total sphingosine 1 phosphate (S1P, r = −0.54, Fig. 5).
A Pearson correlation between changes in the total of each lipid class with changes in different biochemical, cognition and CSF markers. Black diamond, p < 0.05. n = 20 for all correlations except for weight (n = 17), fasting glucose (n = 17), fasting ketones (n = 16), I&D Story recall (n = 19), phosphorylated tau (n = 19), total tau (n = 19), amyloid ratio (n = 19), neurofilament light (n = 13), neurogranin (n = 9), ache (n = 13), bche (n = 13) and their ratio (n = 13). ADAS-COG12: Alzheimer’s Disease Assessment Scale-Cognitive, Cog: Cognition, CSF: Cerebrospinal Fluid, FCSRT: Free and Cued Selective Reminding Test, HbA1C: Hemoglobin A1c, HDL: High-Density Lipoprotein, I&D Story Recall: Immediate and Delayed Story Recall composite, LDL: Low-Density Lipoprotein, MMKD: Modified Mediterranean-Ketogenic Diet, VLDL: Very-Low-Density Lipoprotein. Exact coefficients are in Supplementary Data 7.
Pearson correlation between changes in select lipid species with changes in different biochemical, cognition and CSF markers. Black diamond, p < 0.05. n = 20 for all correlations except for weight (n = 17), fasting glucose (n = 17), fasting ketones (n = 16), I&D Story recall (n = 19), phosphorylated tau (n = 19), total tau (n = 19), amyloid ratio (n = 19), neurofilament light (n = 13), neurogranin (n = 9), ache (n = 13), bche (n = 13) and their ratio (n = 13). AC: Acylcarnitine, ADAS-COG12: Alzheimer’s Disease Assessment Scale-Cognitive, CSF: Cerebrospinal Fluid, FCSRT: Free and Cued Selective Reminding Test, HbA1C: Hemoglobin A1c, HDL: High-Density Lipoprotein, I&D Story Recall: Immediate and Delayed Story Recall composite, LDL: Low-Density Lipoprotein, MMKD: Modified Mediterranean-Ketogenic Diet, TG: Triglyceride, PE: Phosphatidylethanolamine, VLDL: Very-Low-Density Lipoprotein. Exact coefficients are in Supplementary Data 7.
Changes to ADAS-Cog12 (log-transformed) was inversely correlated with changes to many ether lipid classes (PE(O), r = −0.52; PE(P), r = −0.49) (Fig. 5) with stronger species-specific correlations observed in PUFA plasmalogen species (PE(P-16:0/22:6), r = −0.57; PE(P-18:0/22:6) (n6), r = −0.54) (Fig. 6). With MMKD intervention, inverse correlations were observed in changes to very long chain acylcarnitines (AC(26:0), r = −0.50; AC(26:1), −0.57) but not other acylcarnitine species (Fig. 6, Supplementary Data 7). In contrast to ADAS-Cog12, there were fewer correlations observed as significant with changes to the other cognitive measures. FCSRT Immediate (average) had positive correlations with changes seen in many omega-6 esterified species (LPE(20:4) [sn1], r = 0.69, AC(20:4), r = 0.52) while Immediate and delayed story recall composite (I&D Story recall) was positively correlated with some changes in 20:5 species (PE(P-18:0/20:5), r = 0.50) (Supplementary Data 6).
The changes to several CSF biomarkers for AD were correlated with lipid changes after MMKD intervention (Fig. 5, Supplementary Data 7). MMKD-associated changes in the ratio of Aβ42/40 were inversely correlated with changes to total free fatty acids and acylcarnitines (Fig. 5). Unlike associations with ADAS-Cog12, the stronger acylcarnitine correlations were predominately medium in length and in species implicated in the fatty oxidation steps (AC(14:2), r = −0.67; AC(14:1)-OH, r = −0.54) (Fig. 6). While both total and phosphorylated tau changes were not correlated with class total changes, species-specific inverse relationships were observed with 22:6 containing phospholipids (Supplementary Data 7). Interestingly, four subspecies of plasmalogens with an 18:1 (b) isoform on the vinyl-ether were positively associated with changes in phosphorylated tau (Supplementary Data 7). The 18:1 (b) isoform corresponds to the more abundant 18:1 omega-9 isoform. While changes to neurofilament light were weakly inversely related to plasmalogens, they were strongly correlated with changes to saturated and monounsaturated PE species (Fig. 6). Similar to phosphorylated tau, an isoform-specific correlation between plasmalogen and the ratio of acetylcholinesterase / butyrylcholinesterase was observe. This effect was predominately driven by the 18:1 (b) isoform on the vinyl ether (PE(P-18:1/20:4) (b), r = −0.80) (Fig. 6, Supplementary Data 7) with significant positive correlations with omega-3 triglycerides (TG(54:7) [NL-22:6], r = 0.91) (Fig. 6).


